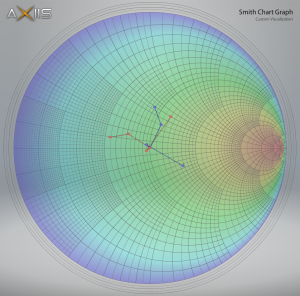
Smith Chart Enhancements for WCAP II
July 26th, 2009
Progress is being made on the Smith Chart enhancement for WCAP. It’s to the point of plotting in-impedances (blue) and out-impedances (red) for a transmission line. Some work still needs to be done on the data input model as well as the hover-over data tips so that you can see the actual values when you mouse-over a point.
